
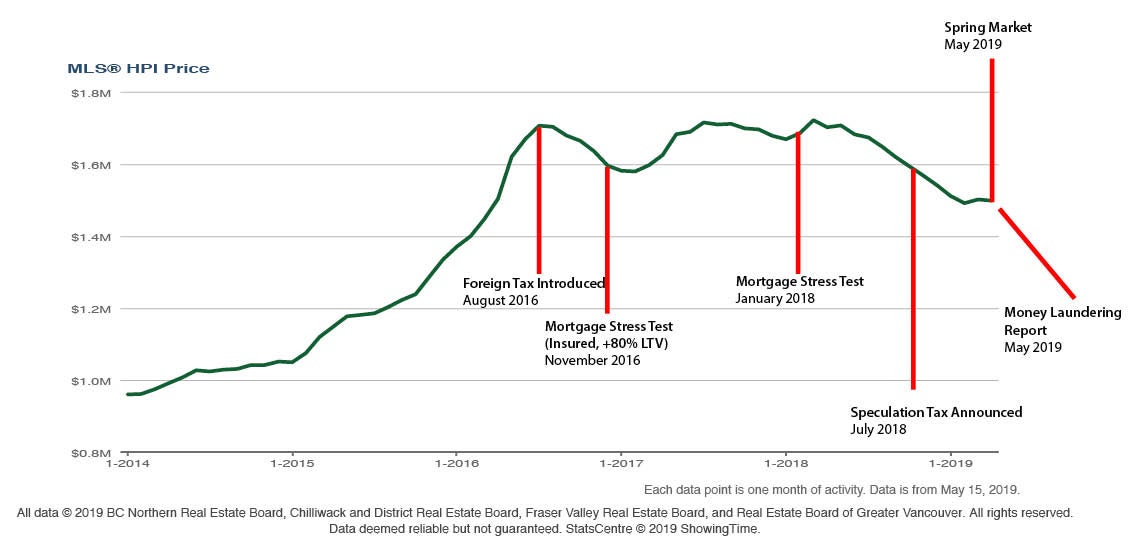
You've heard it enough from the media over the last few months, but I've had a number of client calls for answers to the question of "What's the market doing?" There's no question we are in a downward trend on pricing and sales volume. The below above is a 5-year run on Detached Homes in North Vancouver, and tracks the HPI (Housing Price Index, similar to the average pricing) The chart shows key events that have taken place, in an effort to map how pricing has been affected over the last 5 years, and illustrates a return to DETACHED PRICING to 2016 pricing (3 years ago).
The above is a summary of what's going on, but the reality is that each price point and product (ie: condo, townhouse, detached) is different and responds differently to market forces. Overall, demand is falling and that's due to a number of factors. One is that the supply side of things (inventory) is building up. As Sales-to-Active ratio continually falls, we see fewer homes selling and more homes listing. As inventory builds up, buyers have more choices and spend a lot more time searching (and negotiating) on offers.
Not necessarily. Predicting the market bottom is challenging (similar to the stock market) and being back to 2016 pricing is giving lots of buyers opportunities to enter the market a bit more comfortably. It's also allowing lots of families the opportunity to Move-Up-Market, where their current home has dropped 10% in pricing, but their higher value purchase has also dropped 10% (a savings for the buyer). A quick example, and a reason why the market is still "active"
The above is a summary of what's going on, but the reality is that each price point and product (ie: condo, townhouse, detached) is different and responds differently to market forces. Overall, demand is falling and that's due to a number of factors. One is that the supply side of things (inventory) is building up. As Sales-to-Active ratio continually falls, we see fewer homes selling and more homes listing. As inventory builds up, buyers have more choices and spend a lot more time searching (and negotiating) on offers.
WAS APRIL THE START OF THE SPRING MARKET?..
Better Dwelling, a fantastic Vancouver-based blog for housing in some of the key major cities Nationally and Internationally, reported this morning the following, which illustrates its been one of the slowest April selling seasons in more than 20 years:
REBGV recorded 586 sales in April, up 10.8% from the month before. This represents a 27.02% decline compared to the same month last year. The monthly increase is seasonally expected, but the annual decline is not. This was the fewest detached sales for April in at least 20 years, as far as REBGV data went back. As for the City of Vancouver, it was the fewest detached sales for April since 1992.
ALL DOOM AND GLOOM?
Not necessarily. Predicting the market bottom is challenging (similar to the stock market) and being back to 2016 pricing is giving lots of buyers opportunities to enter the market a bit more comfortably. It's also allowing lots of families the opportunity to Move-Up-Market, where their current home has dropped 10% in pricing, but their higher value purchase has also dropped 10% (a savings for the buyer). A quick example, and a reason why the market is still "active"
Clients home value in 2017: $1.5M
Clients "larger" home purchase in 2019: $2.5M
($1M additional mortgage gap)
-----
Clients home value today (2019): :$1.35M (roughly 10% decrease)
Clients "larger" home purchase today (2019): $2.1 (the higher end home has declined more than 10%)
($750,000 additional mortgage gap)