

Pulling data (January --> Today) for New Listings and Sold data for the detached market, I was curious the rate we are adding both new inventory and how fast homes are moving(selling). One general observation of what I'm seeing each day over the past 2-3 weeks, has been increased sales quantity (volume of homes selling, most within 5-7 days of listing), but also the value of those homes seemed to be increasing. Seeing higher priced (new contruction) homes selling for premiums to what they were selling for a few months ago.... almost brought back the feeling of 2021!
NORTH VANCOUVER NEW LISTINGS ("FRESH")
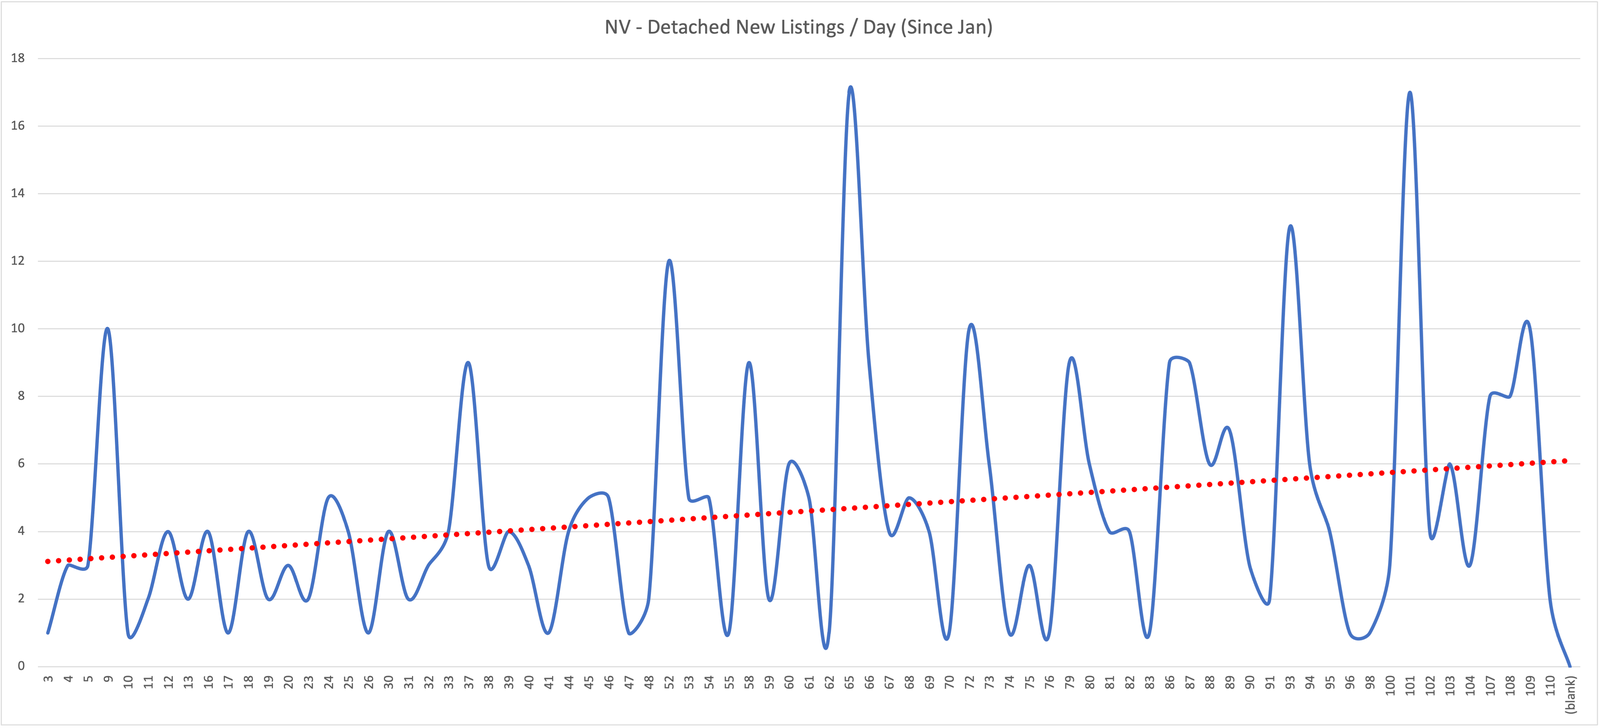
(North Vancouver Detached New Listings, daily, since Jan 01, 2023.)
This figure above is looking at "Fresh" new listings hitting the MLS, not including the inventory already on the market at the given time. The Sprint Market wasn't really a big increase in inventory like we see in typical markets. However, there has been a gradual increase in the last 2 months for new listings. Lots of this inventory has come from sellers seeing a return to a robust sellers market, and want to capitalize.
NORTH VANCOUVER SALES
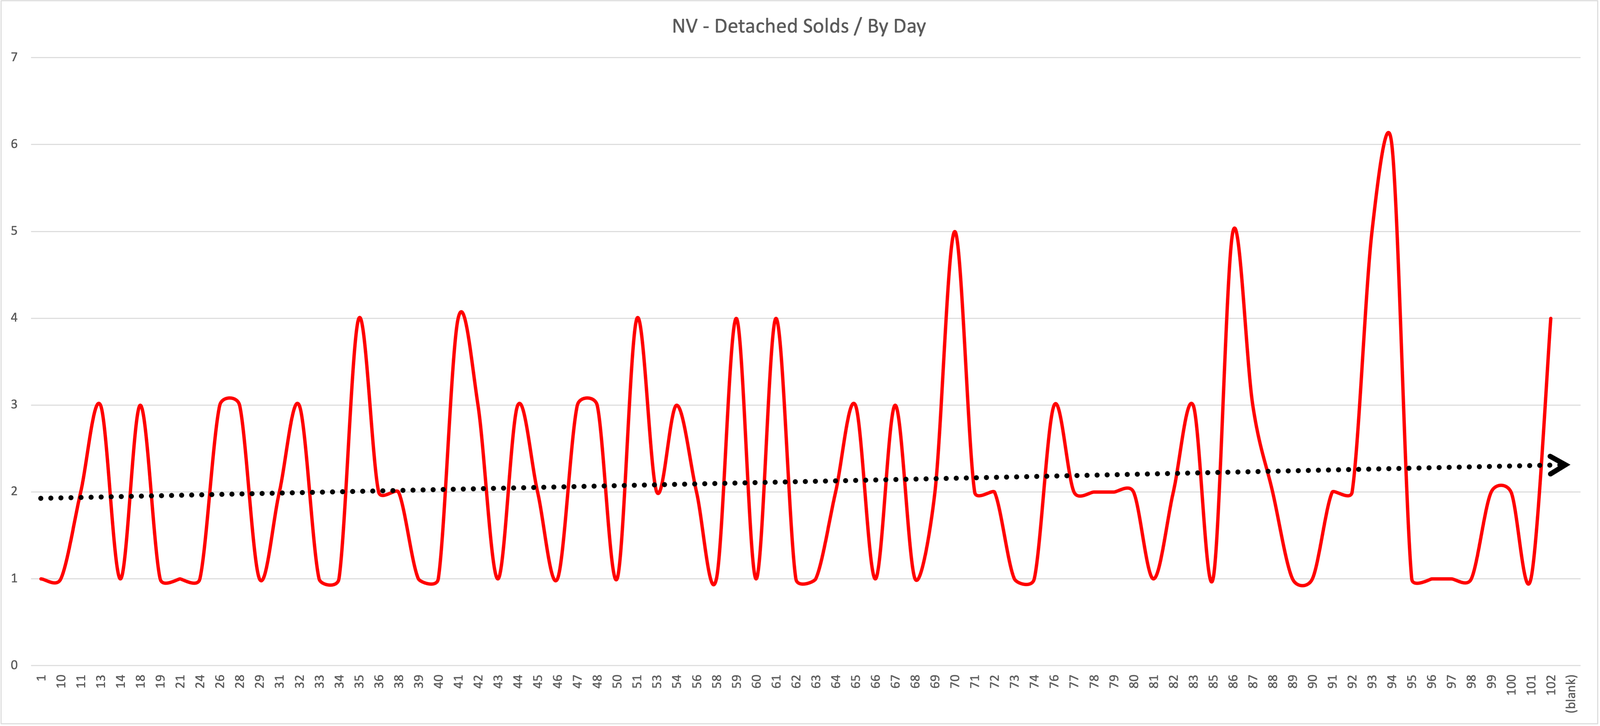
(North Vancouver SOLDS in Detached Homes, daily, since Jan 01, 2023)
Gradual increase on an "average" count since Jan 01, 2023 in QUANTITY of homes sold each day on MLS in North Vancouver. This graph get's a bit skewed by the fact that MLS is closed over weekends, so the large upticks are Monday sales reports from the previous 72hrs (Fri, Sat, Sun) sales that didn't process.
The only thing I notice from this graph is the "average" line is increasing, but also those "Monday Updates" are getting larger, reflecting a busier buyer pool. Market is selling through more homes.
DOLLAR VOLUME
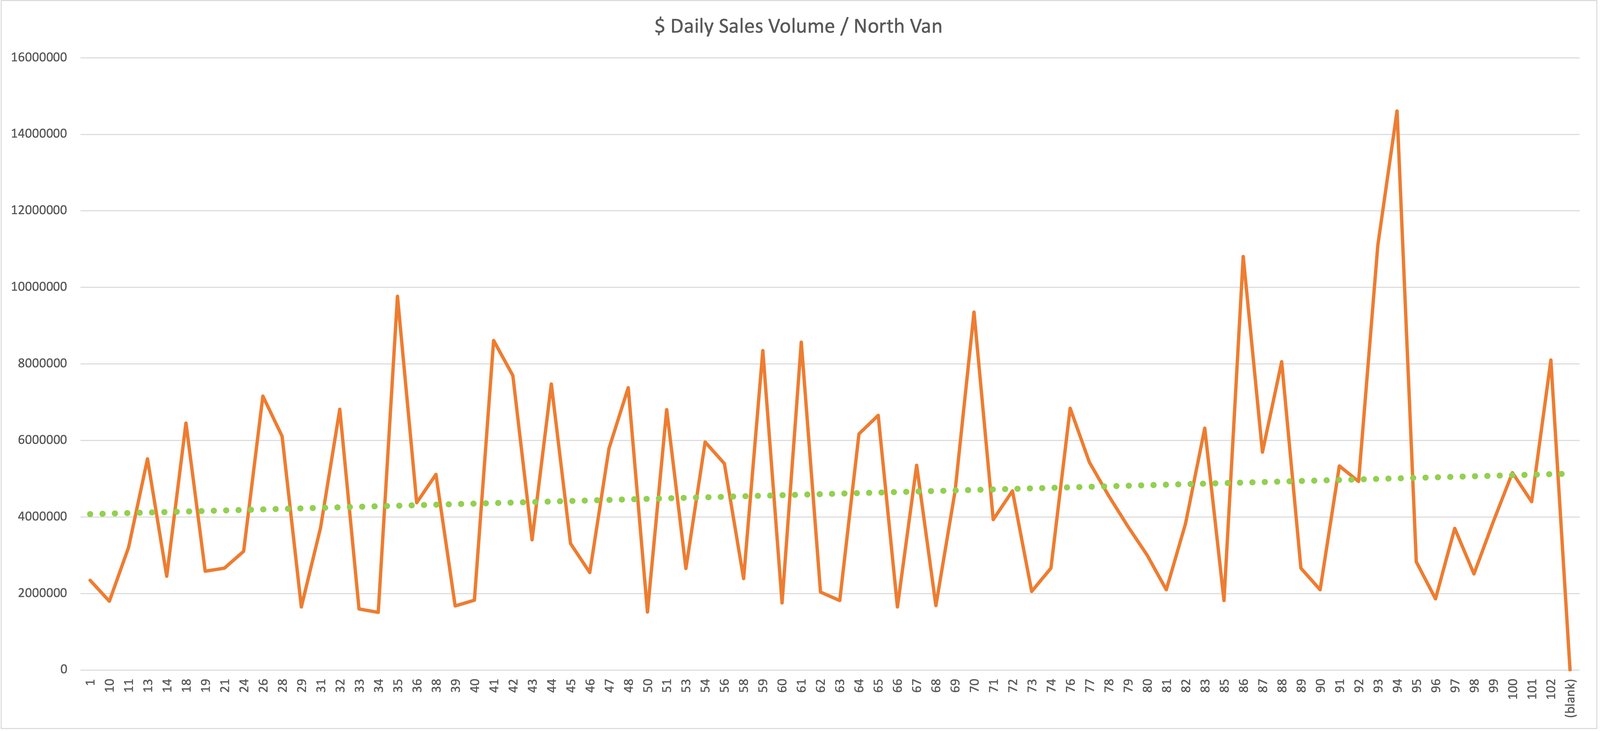
(Dollar volume daily sales, Detached North Vancouver Market ONLY)
I actually love watching this value, and comparing it to above listings and solds, to give a monitor of the overall dollar volume transacting daily. Without even looking at the average trendline, we can see those peaks are getting bigger as the Spring Market continues.
However, I can see that we are selling higher-end "premium" homes in this current market. You can see the last 10 days or so, we are averaging 1-2 sales a day in the above RED graph, but the ORANGE graph in this section is showing an above $2M or $4M on those respected days...
This is confirmed by observations of the recent sales such as:
3035 Newmarket - 2004 Build Edgemont Home $4,498,000 (sold $4,400,000 April 11) Click Here to View Listings
2880 Thorncliffe Drive - 1956 Renovated Edgemont Home $3,799,000 (sold $3,700,000 April 07) Click Here to View Listings
548 E 6th Street - Newly build 3700 sq ft home in Queensbury $3,778,000 (sold $3,595,238 April 03) Click Here to View Listings
It would appear this Spring Market is fast-paced. Lots of multiple offers, limited quality inventory for buyers, so competition is likely. Looking for more answers, reach out and let's see how we can align your goals.
Happy Week!
Brandon